Locally, atmospheric pressure varies over time. The amplitude of this variation corresponds to the alternation of compressions and decompressions of a volume of air. This variation in compression/decompression will propagate and will cause our eardrums to vibrate: the perception of sound.
This temporal variation is complex and can be considered as the combination or sum of random variations — noise — together with variations that repeat identically over time, producing in particular the sensation of pitch or musical notes: the signal.
Because they repeat identically over time, they carry a reproduction frequency F, i.e. a number of cycles per second whose unit is the Hertz (Hz).
In physics, frequency in Hertz is the number of times a phenomenon repeats itself identically over a duration of 1 second.
Each cycle has a certain duration in seconds called the period T. The number of cycles per second F and the duration of each cycle T are related by: $$F = 1/T$$
These variations are called periodic. They are themselves the sum of elementary periodic variations described mathematically by sinusoids.
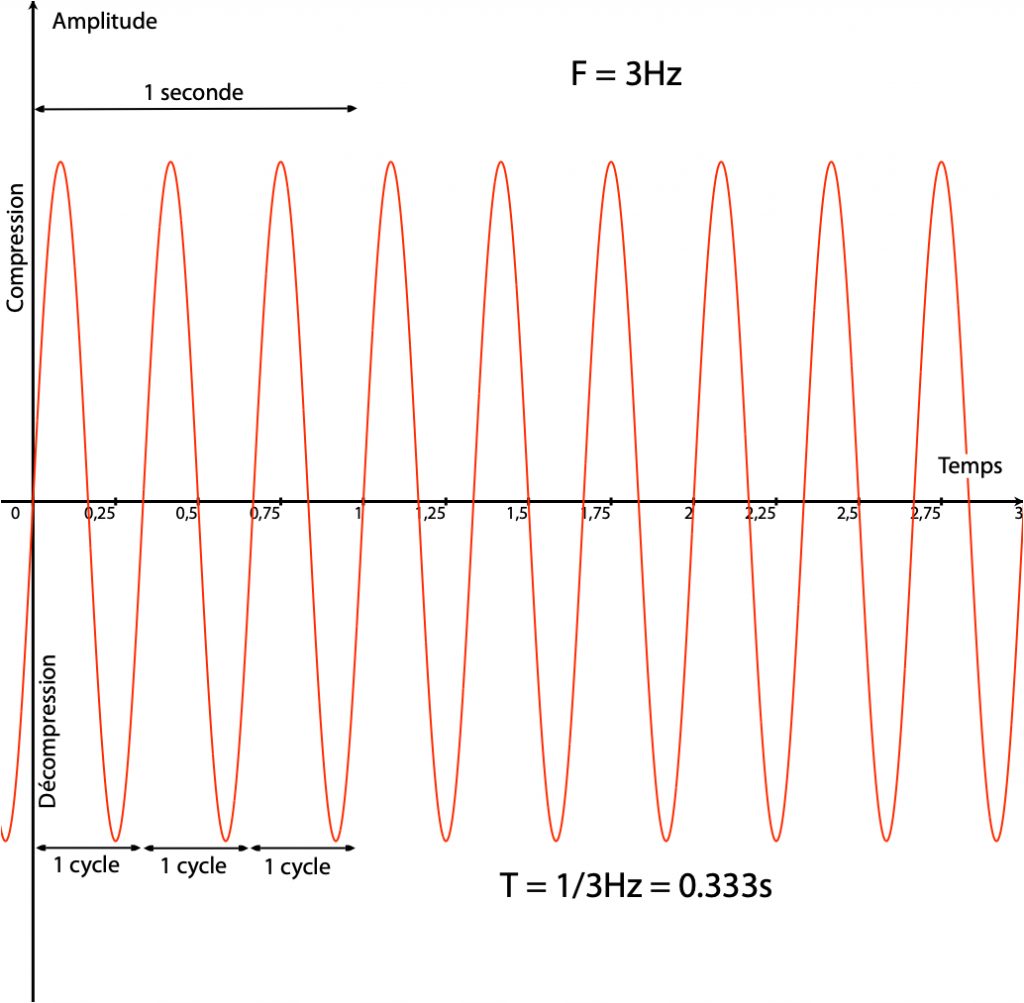
Sinusoidal variation of pressure over time, measured locally (at the listening point).
The figure above represents the local variation of pressure over time, i.e. at a specific point in space. Here, this pressure variation is elementary, simple, regular, and periodic. It corresponds to a well-known temporal function: the sinusoidal function.
(p(t)=A(t)times sin(2pi ftimes t))
A(t): the amplitude or maximum value of the compression and decompression. It evolves over time (t).
(sin(2pi ftimes t)): the (sin(…)) function, sine, describes the cyclic variation of a point rotating on the circumference of a unit circle (a circle of radius 1).
(t): time, which varies — this is our variable.
(f ): the frequency of variation, which is fixed here and therefore constant.
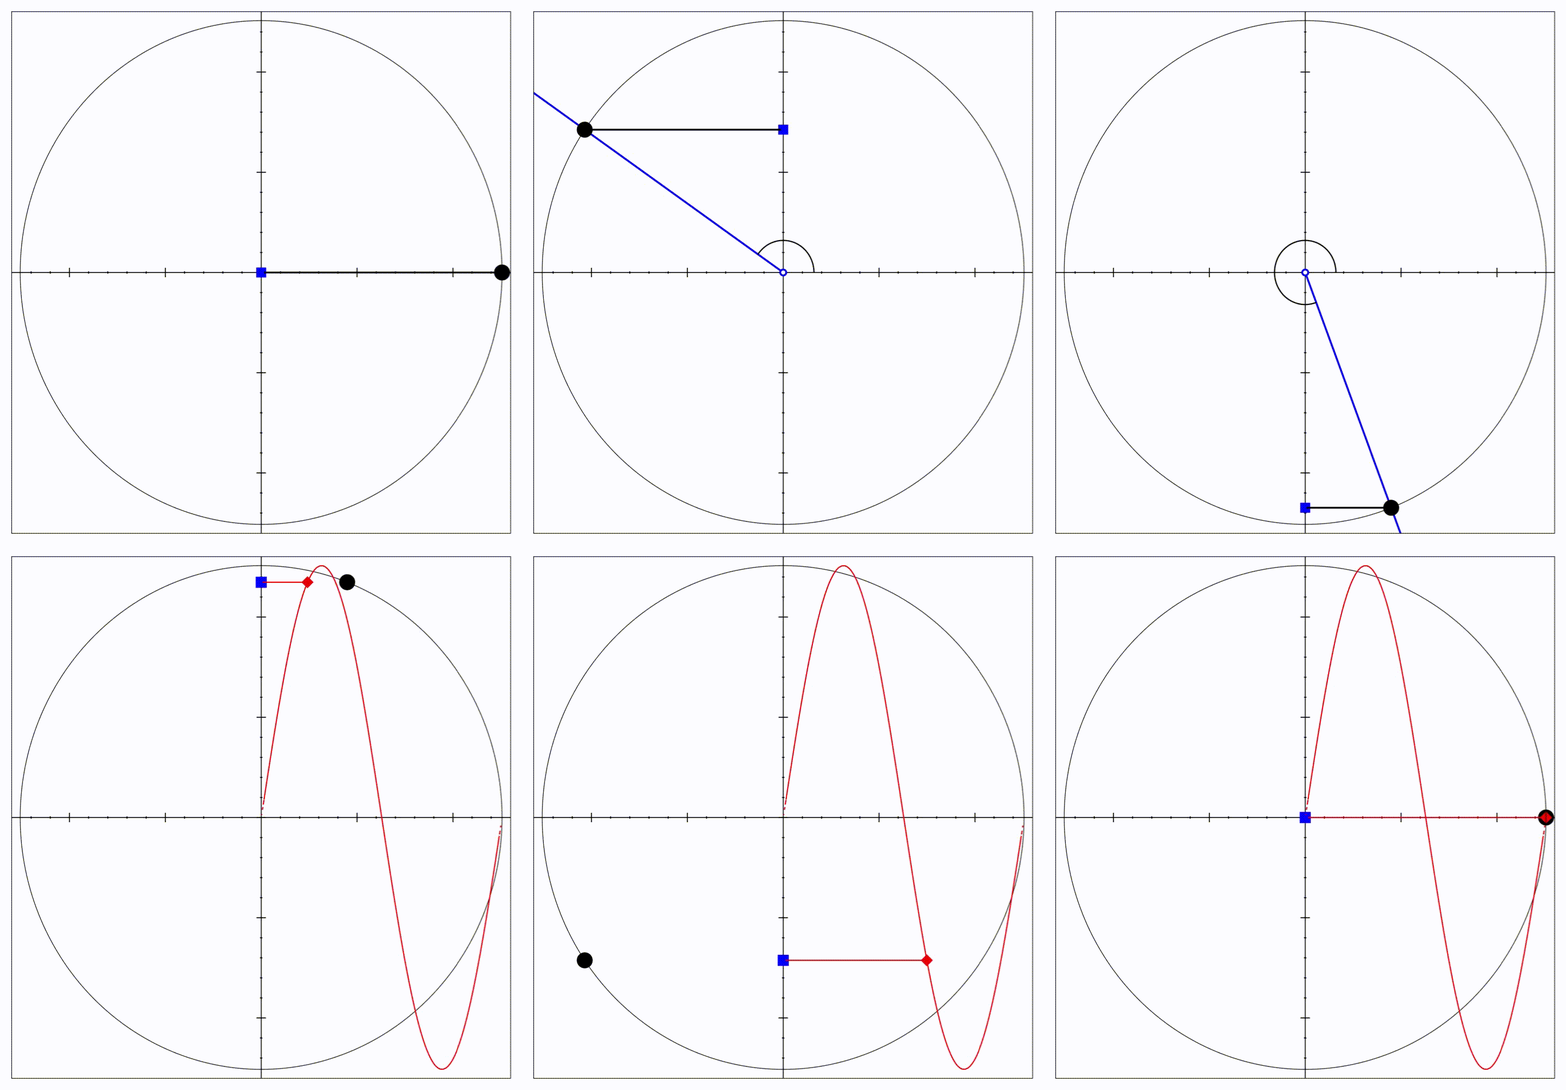
Illustration of an elementary sinusoidal variation.
A point rotates on a circle of radius (A). The blue square is its projection onto the y-axis (y) as a function of angle (which varies over time (2pi ftimes t)). It traces a sinusoid when its position is unrolled along the x-axis (x).
Thus, the complete set of all frequencies of these elementary variations describes the spectrum of the acoustic wave signal. As the listener’s perception of the sound evolves over time, the spectrum also varies and certain frequencies appear and disappear.